Automated Product Testing Solutions
Blind Benchmarking
Benchmark your product versus your competitors’ to identify areas of superiority to capitalize on, or pinpoint opportunities for optimization.


Design
Blind


Assessment
Sequential Monadic


Methodology
CLT: 2-6 products | IHUT: 2-3 products


Timeline
From 10 days
Markets:
Why Blind Benchmarking?
Whether pre- or post-launch, ensuring your product stands out is essential. To secure its place on the shelf, and in consumers' repertoires, it must offer something better or distinctly different.
Our Blind Benchmarking tool helps you pinpoint areas where your product excels, as well as opportunities for optimization, ensuring it remains competitive and compelling.
Outputs
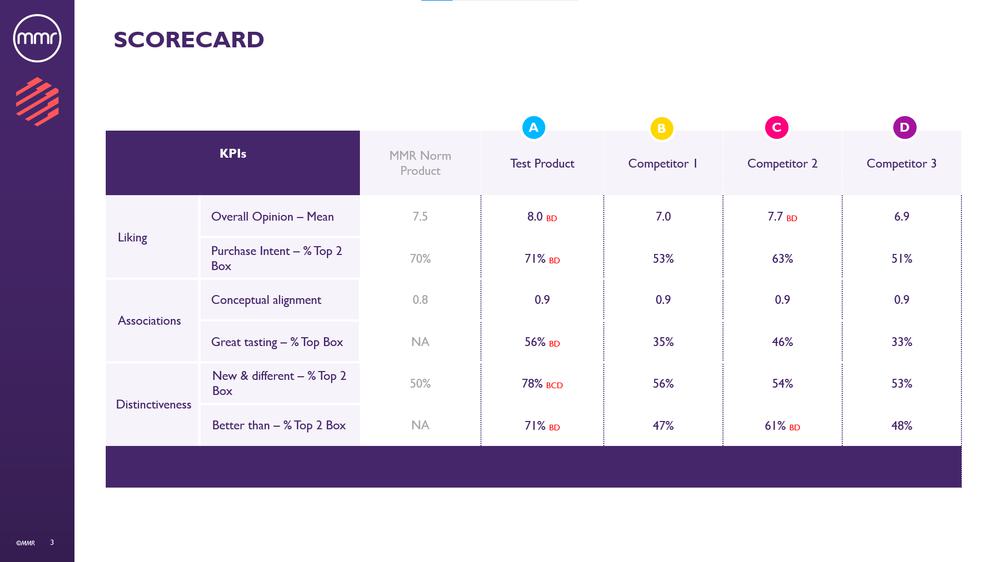
Performance of products on KPIs - to identify strengths & weaknesses of a product
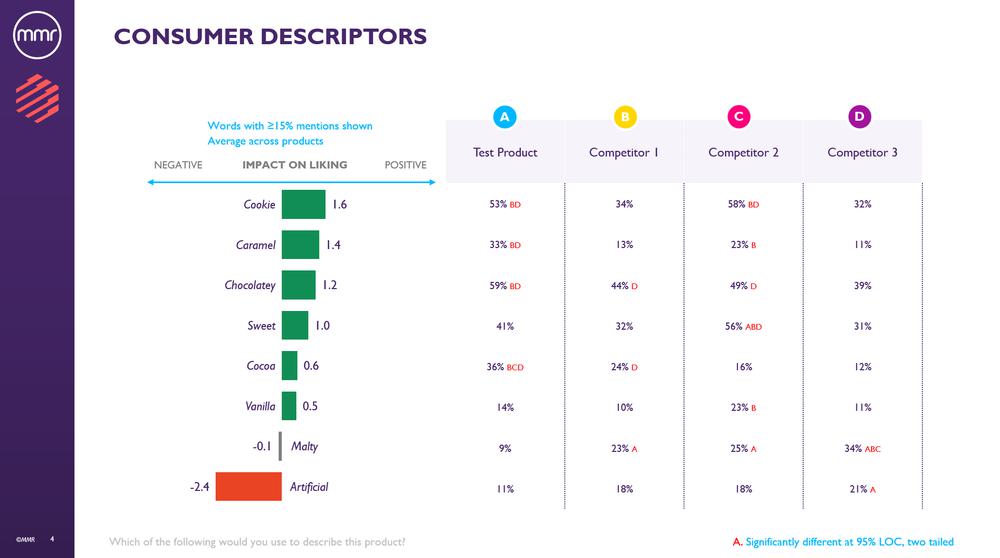
Said not Said - to understand which parts of the sensory experience drive appeal
Brand recognition - to understand how recognizable your product experience is
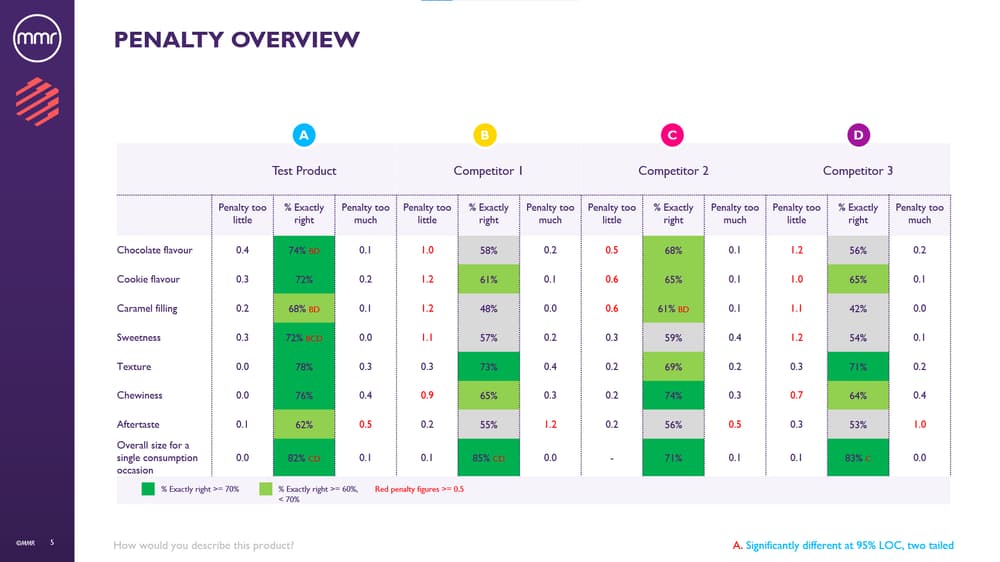
Penalty Analysis - to identify further optimization, where required
Other Solutions
Sensory Portrait™
Generate objective diagnostics that unpack the key discriminatory sensory touchpoints of your product. When linked with consumer data, identify opportunities to optimize and assess to protect. Powered by MMR's trained sensory science panels.
Prototype Screening
Track that you're on target to delight your consumers, prioritize formulations to take forward, and identify optimization opportunities.

Branded Benchmarking
Benchmark your holistic product experience - brand, pack, and product - versus your key competitor to identify areas of superiority, or pinpoint opportunities for optimization.